

About Transportation
We provide safe, clean, efficient transportation choices and rights-of-way to enhance mobility and quality of life.
Transportation manages and maintains a vast network of roads, sidewalks, bridges, bicycle facilities, airports, and other transportation infrastructure in the unincorporated areas of the County as well as contract cities; and manages various programs and services to enhance safety and minimize traffic congestion. The Transportation Business Plan establishes various strategies to improve community well-being and livability and to expand Countywide mobility and opportunities for alternate transportation choices.Our Services

Report a Problem
Report graffiti, potholes, illegal dumping, water-wasting, and other problems here.

Locate Services in My Area
Find County services for construction, utilities, road, or transportation-related services in or near your area.

Apply for a Permit
Search for permits related to Building and Safety, Transporation, Road, Environmental, Flood Control, and Bikeways in LA County.
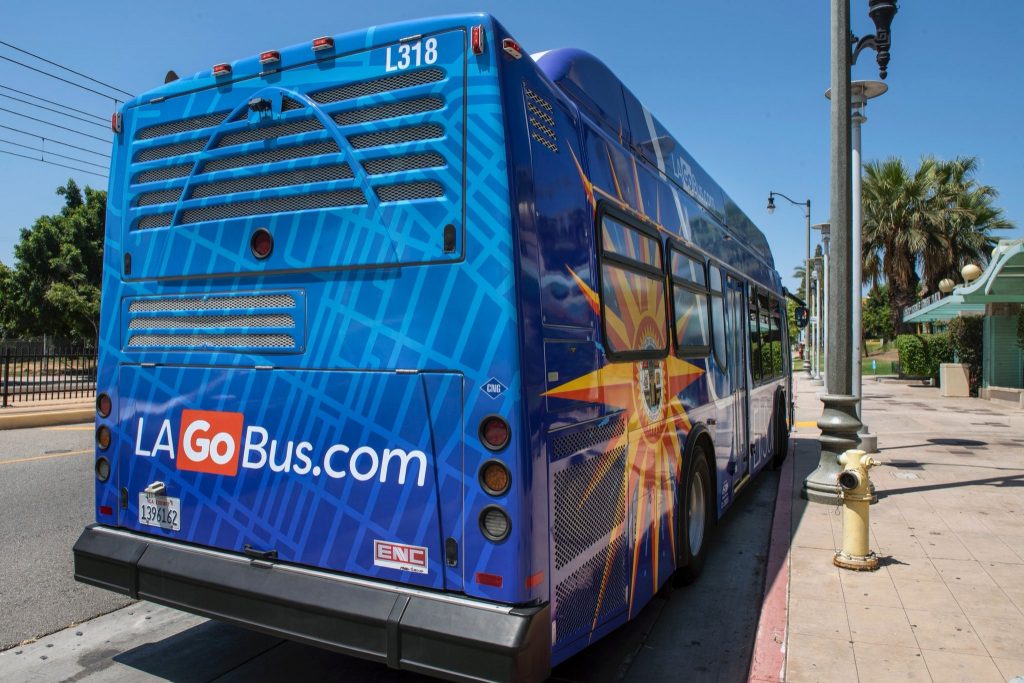
Community Transit
Unincorporated County of Los Angeles transit services.
Programs & Initiatives

About Transportation
We provide safe, clean, efficient transportation choices and rights-of-way to enhance mobility and quality of life.
Transportation manages and maintains a vast network of roads, sidewalks, bridges, bicycle facilities, airports, and other transportation infrastructure in the unincorporated areas of the County as well as contract cities; and manages various programs and services to enhance safety and minimize traffic congestion. The Transportation Business Plan establishes various strategies to improve community well-being and livability and to expand Countywide mobility and opportunities for alternate transportation choices.